LogiStream Analytics is a B2B SaaS frontend showcasing a data-driven landing page and dashboard with advanced tables for real-time analytics
LogiStream Analytics represents a comprehensive B2B SaaS solution designed to transform how enterprises interact with complex data. This frontend project showcases a sophisticated landing page and user dashboard that prioritizes data visualization through advanced table interfaces, enabling businesses to make informed decisions based on real-time analytics.
Landing Page Design
The landing page serves as the gateway to the platform, featuring a clean, professional design that immediately communicates value to potential enterprise clients. The interface emphasizes clarity and trust, with strategic placement of key features, customer testimonials, and interactive demonstrations of the platform's data visualization capabilities.
Key elements include a hero section with compelling messaging, feature highlights that showcase the platform's analytical power, and clear calls-to-action that guide visitors through the conversion funnel. The design system maintains consistency across all touchpoints while ensuring optimal performance and accessibility.
User Dashboard Architecture
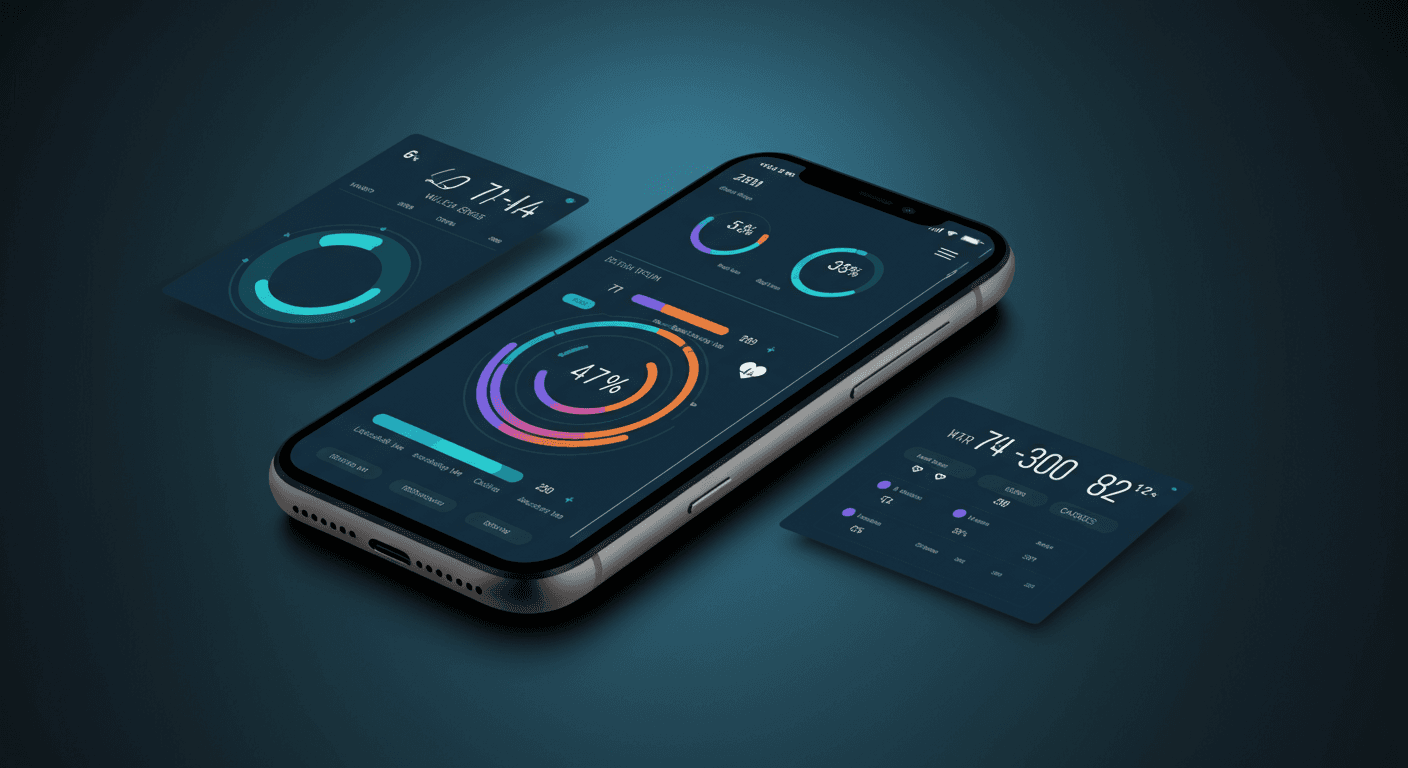
The user dashboard represents the core of the LogiStream Analytics experience. Built with modern frontend technologies, it provides a responsive and intuitive interface for managing and analyzing large datasets. The dashboard architecture prioritizes performance, ensuring smooth interactions even when handling millions of data points.
Navigation and Layout
The dashboard features a sidebar navigation system that provides quick access to different analytical views and data sources. The main content area adapts dynamically based on user selections, with a flexible grid system that accommodates various visualization components. Contextual menus and keyboard shortcuts enhance productivity for power users.
Complex Data Visualization Tables
At the heart of LogiStream Analytics are its advanced data visualization tables, designed to handle complex datasets with ease. These tables go beyond simple row-and-column displays, offering sophisticated features that enable deep data exploration and analysis.
Key Table Features
The visualization tables include several advanced capabilities:
- Dynamic sorting and filtering across multiple columns with saved filter presets
- Column grouping and hierarchical data display for nested information structures
- Inline editing capabilities with real-time validation and conflict resolution
- Customizable column configurations that users can save and share across teams
- Advanced aggregation functions including sum, average, median, and custom calculations
- Virtual scrolling for optimal performance with large datasets
Visual Enhancements
The tables incorporate visual elements that make data interpretation intuitive. Conditional formatting highlights important values, trends, and anomalies. Sparklines embedded within cells provide at-a-glance trend visualization. Color-coded indicators and progress bars transform raw numbers into actionable insights.
Technical Implementation
The frontend architecture leverages modern web technologies to deliver a responsive and performant experience. The application uses component-based architecture for maintainability and reusability. State management ensures consistent data flow across the application, while optimized rendering techniques prevent performance bottlenecks.
Performance Optimization
Several optimization strategies ensure smooth operation even with complex datasets. Lazy loading defers non-critical resources, while code splitting reduces initial bundle size. Memoization prevents unnecessary re-renders, and web workers handle intensive calculations off the main thread. The result is a fluid user experience that scales with data complexity.
User Experience Considerations
Every aspect of LogiStream Analytics prioritizes user experience. The interface adapts to different screen sizes and devices, ensuring accessibility across desktop, tablet, and mobile platforms. Thoughtful loading states and error handling maintain user confidence during data operations. Comprehensive keyboard navigation and screen reader support ensure the platform is accessible to all users.
The design system incorporates user feedback gathered through extensive testing, resulting in an interface that feels both powerful and approachable. Contextual help and onboarding flows guide new users, while advanced features remain readily available for experienced analysts.
Project Outcomes
LogiStream Analytics demonstrates the potential of modern frontend development in creating sophisticated B2B SaaS applications. The project successfully balances complex functionality with intuitive design, proving that enterprise software can be both powerful and user-friendly. The data visualization tables serve as a testament to what's possible when thoughtful design meets technical excellence.
More to Read